UHD / Office of the Provost / Office of Institutional Effectiveness / Office of Data Analytics & Institutional Research / Baccalaureate Degrees Awarded by Gender & Ethnicity
Baccalaureate Degrees Awarded by Gender & Ethnicity
*This page is best viewed in landscape mode
Female Male Overall Back to Fact Book Home
Female
| 2019 - 2020 | 2020 - 2021 | 2021 - 2022 | 2022 - 2023 | 2023 - 2024 | % change from Previous Year |
||||||
|---|---|---|---|---|---|---|---|---|---|---|---|
| # | % | # | % | # | % | # | % | # | % | ||
| American Indian or Alaska Native | 5 | 0.3% | 2 | 0.1% | 2 | 0.1% | 2 | 0.1% | 1 | 0.1% | -50.0% |
| Asian | 114 | 6.5% | 154 | 7.8% | 141 | 6.8% | 114 | 6.3% | 120 | 6.2% | 5.3% |
| Black or African American | 348 | 19.8% | 415 | 21.0% | 406 | 19.6% | 359 | 20.0% | 417 | 21.6% | 16.2% |
| Hispanic/Latino | 931 | 53.0% | 984 | 49.7% | 1,123 | 54.3% | 992 | 55.2% | 1,072 | 55.5% | 8.1% |
| White | 272 | 15.5% | 307 | 15.5% | 281 | 13.6% | 224 | 12.5% | 215 | 11.1% | -4.0% |
| Native Hawaiian or Other Pacific Islander | 5 | 0.3% | 3 | 0.2% | 0 | 0.0% | 0 | 0.0% | 1 | 0.1% | - |
| Two or More Races | 35 | 2.0% | 46 | 2.3% | 54 | 2.6% | 47 | 2.6% | 53 | 2.7% | 12.8% |
| International | 33 | 1.9% | 48 | 2.4% | 46 | 2.2% | 50 | 2.8% | 42 | 2.2% | -16.0% |
| Race and ethnicity unknown | 14 | 0.8% | 20 | 1.0% | 17 | 0.8% | 9 | 0.5% | 9 | 0.5% | 0.0% |
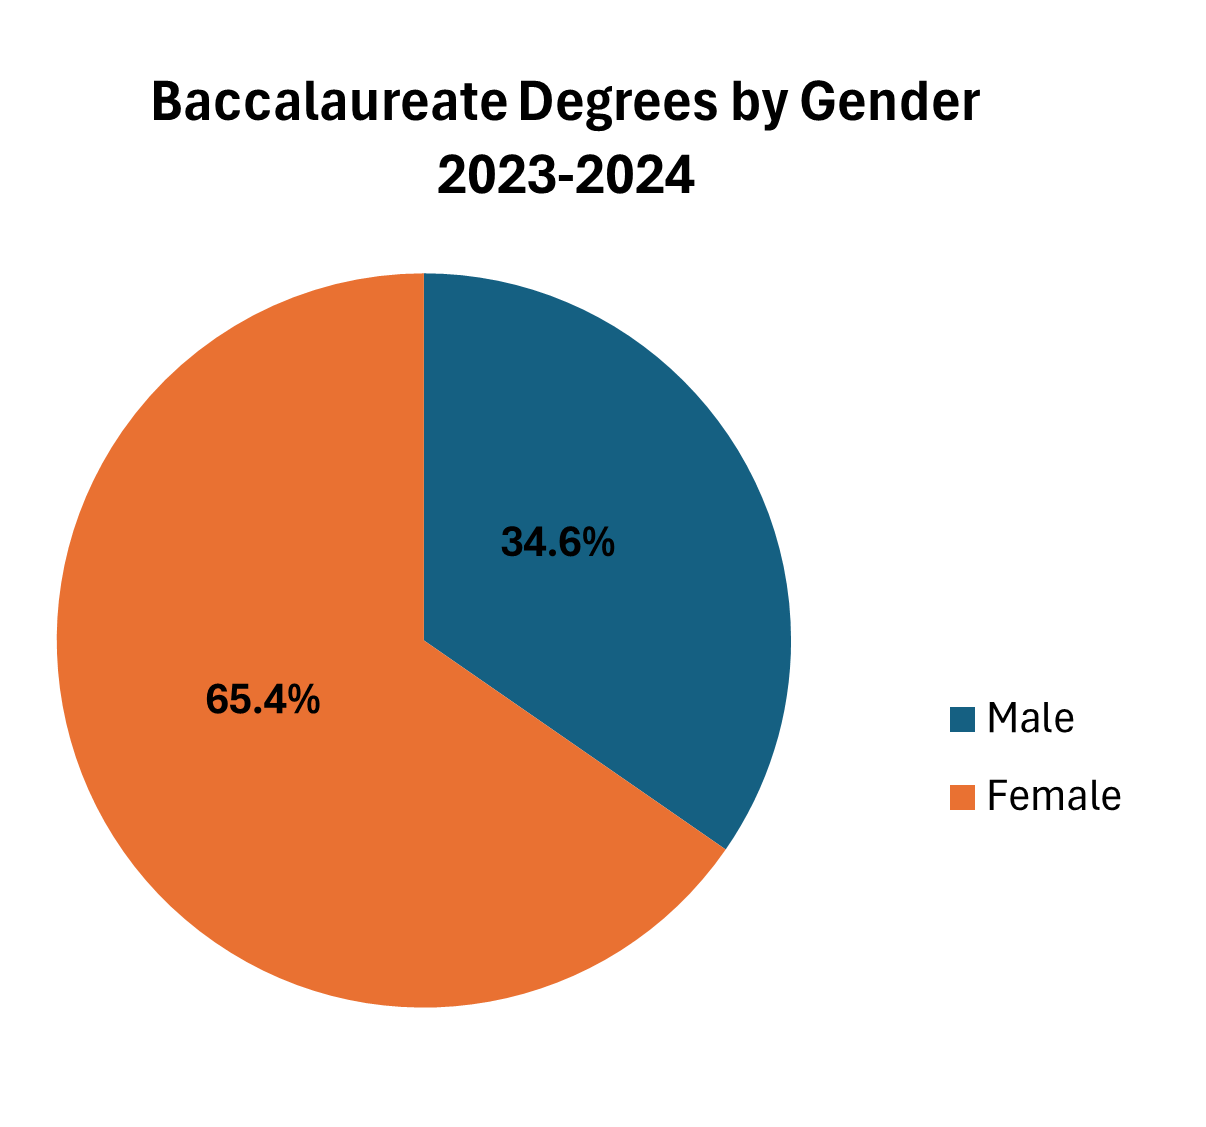
| Total Females | 1,757 | 100.0% | 1,979 | 100.0% | 2,070 | 100.0% | 1,797 | 100.0% | 1,930 | 100.0% | 7.4% |
Male
| 2019 - 2020 | 2020 - 2021 | 2021 - 2022 | 2022 - 2023 | 2023 - 2024 | % change from Previous Year |
||||||
|---|---|---|---|---|---|---|---|---|---|---|---|
| # | % | # | % | # | % | # | % | # | % | ||
| American Indian or Alaska Native | 3 | 0.3% | 1 | 0.1% | 4 | 0.4% | 1 | 0.1% | 1 | 0.1% | 0.0% |
| Asian | 134 | 14.0% | 131 | 13.1% | 115 | 11.3% | 124 | 13.2% | 126 | 12.3% | 1.6% |
| Black or African American | 163 | 17.1% | 157 | 15.7% | 166 | 16.2% | 148 | 15.8% | 157 | 15.3% | 6.1% |
| Hispanic/Latino | 389 | 40.8% | 451 | 45.0% | 465 | 45.5% | 451 | 48.1% | 487 | 47.6% | 8.0% |
| White | 207 | 21.7% | 185 | 18.4% | 207 | 20.3% | 154 | 16.4% | 187 | 18.3% | 21.4% |
| Native Hawaiian or Other Pacific Islander | 5 | 0.5% | 0 | 0.0% | 1 | 0.1% | 1 | 0.1% | 1 | 0.1% | 0.0% |
| Two or More Races | 13 | 1.4% | 25 | 2.5% | 26 | 2.5% | 25 | 2.7% | 27 | 2.6% | 8.0% |
| International | 33 | 3.5% | 43 | 4.3% | 27 | 2.6% | 30 | 3.2% | 32 | 3.1% | 6.7% |
| Race and ethnicity unknown | 7 | 0.7% | 10 | 1.0% | 11 | 1.1% | 4 | 0.4% | 5 | 0.5% | 25.0% |
| Total Males | 954 | 100.0% | 1,003 | 100.0% | 1,022 | 100.0% | 938 | 100.0% | 1,023 | 100.0% | 9.1% |
Overall
| 2019 - 2020 | 2020 - 2021 | 2021 - 2022 | 2022 - 2023 | 2023 - 2024 | % change from Previous Year |
||||||
|---|---|---|---|---|---|---|---|---|---|---|---|
| # | % | # | % | # | % | # | % | # | % | ||
| American Indian or Alaska Native | 8 | 0.3% | 3 | 0.1% | 6 | 0.2% | 3 | 0.1% | 2 | 0.1% | -33.3% |
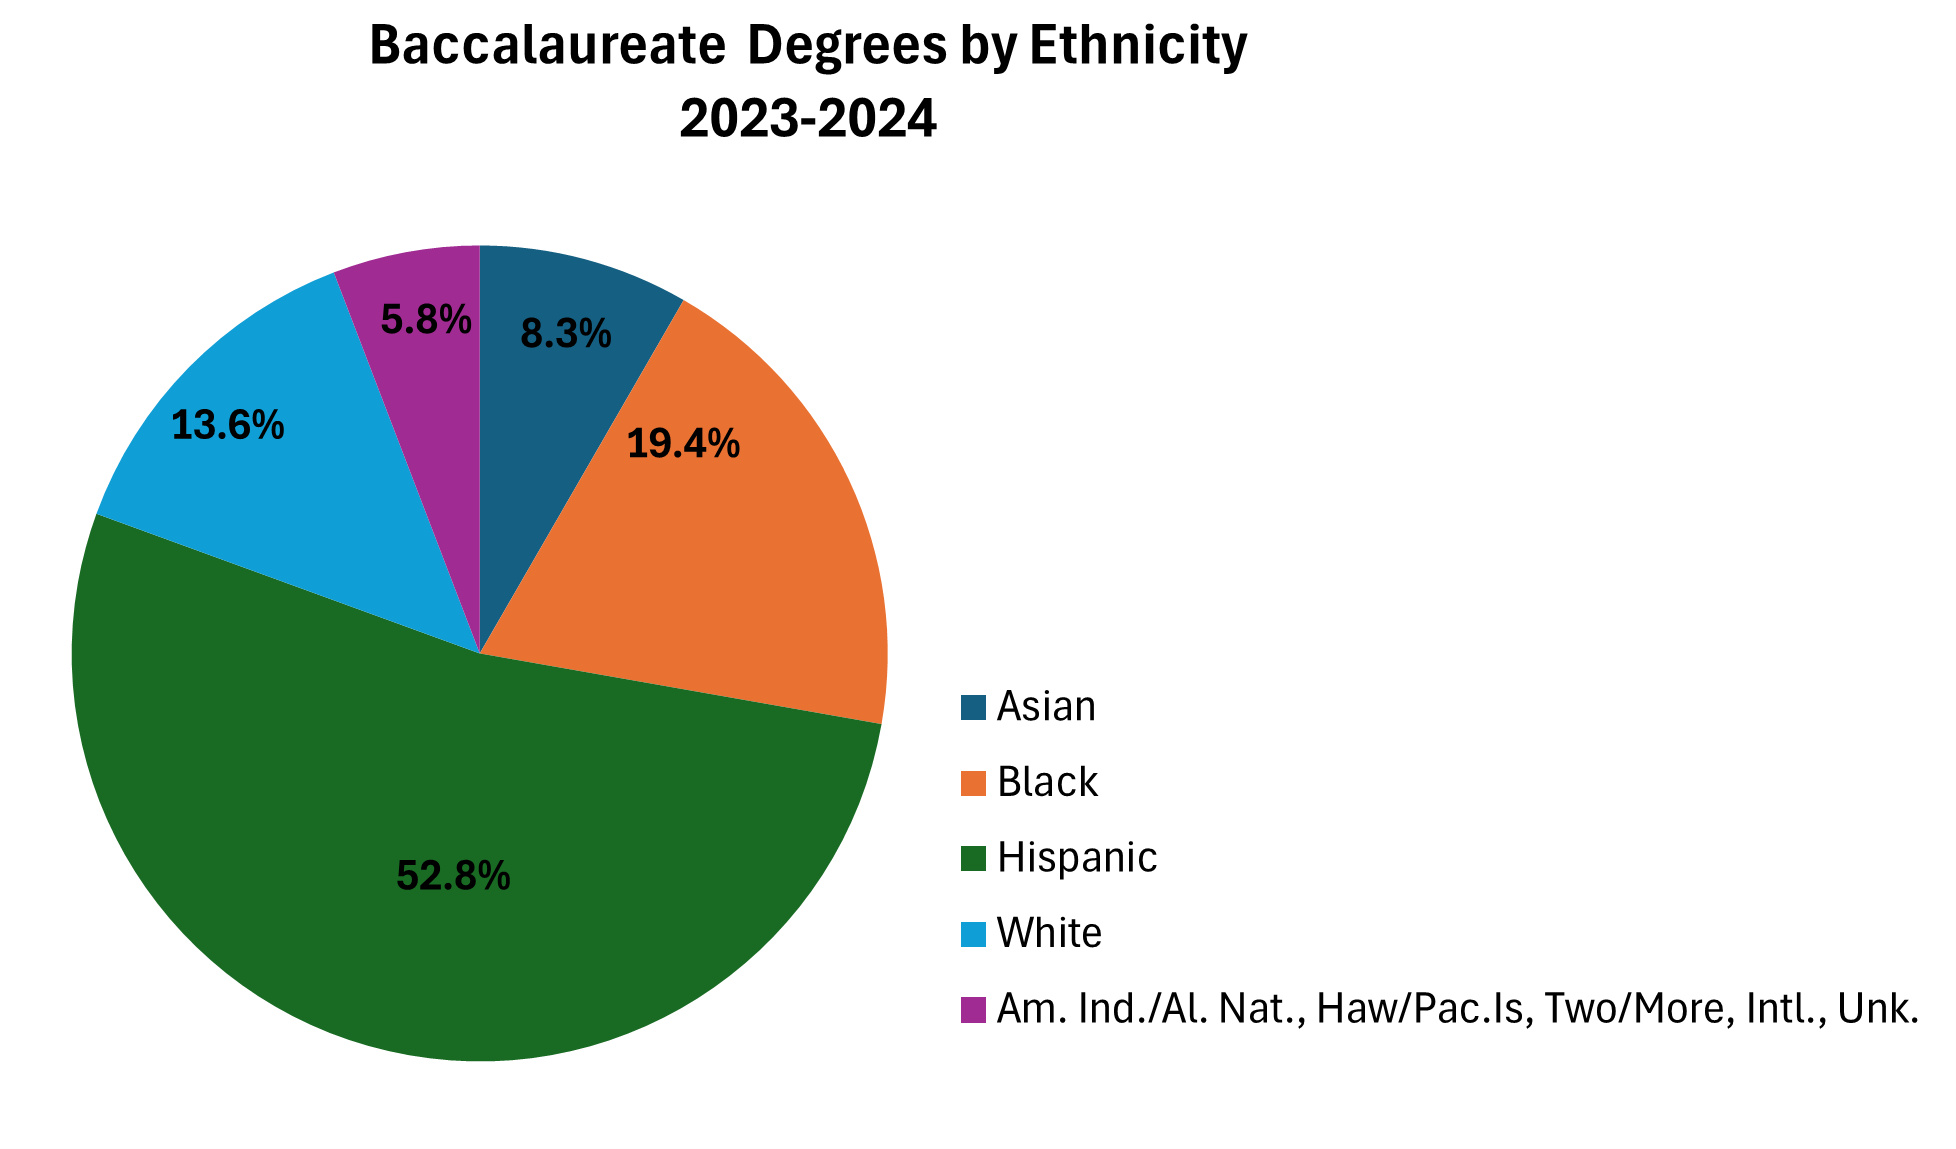
| Asian | 248 | 9.1% | 285 | 9.6% | 256 | 8.3% | 238 | 8.7% | 246 | 8.3% | 3.4% |
| Black or African American | 511 | 18.8% | 572 | 19.2% | 572 | 18.5% | 507 | 18.5% | 574 | 19.4% | 13.2% |
| Hispanic/Latino | 1,320 | 48.7% | 1,435 | 48.1% | 1,588 | 51.4% | 1,443 | 52.8% | 1,559 | 52.8% | 8.0% |
| White | 479 | 17.7% | 492 | 16.5% | 488 | 15.8% | 378 | 13.8% | 402 | 13.6% | 6.3% |
| Native Hawaiian or Other Pacific Islander | 10 | 0.4% | 3 | 0.1% | 1 | 0.0% | 1 | 0.0% | 2 | 0.1% | 100.0% |
| Two or More Races | 48 | 1.8% | 71 | 2.4% | 80 | 2.6% | 72 | 2.6% | 80 | 2.7% | 11.1% |
| International | 66 | 2.4% | 91 | 3.1% | 73 | 2.4% | 80 | 2.9% | 74 | 2.5% | -7.5% |
| Race and ethnicity unknown | 21 | 0.8% | 30 | 1.0% | 28 | 0.9% | 13 | 0.5% | 14 | 0.5% | 7.7% |
| Grand Total 1 | 2,711 | 100.0% | 2,982 | 100.0% | 3,092 | 100.0% | 2,735 | 100.0% | 2,953 | 100.0% | 8.0% |
Source: CBM009
1 Total may differ from previous page because a student may have multiple majors but is counted only once by gender and ethnicity.