JIT Modules for R studio
Dr. Bernadette Hence - DOED MSEIP Program Director
Dr. Katherine Shoemaker – Co-Principal Investigator
Kevin Sheard and John Beall
Grant award DOED MSEIP #P120A220015
University of Houston-Downtown
Overview
These tutorial modules cover topics starting from the installation of R and RStudio. Students are taught to navigate the layout of the RStudio IDE and basic R syntax.
Additionally, the videos cover data visualization using the ggplot2 package and data manipulation using the dplyr package, which are the current standard for Data reporting in R.
Modules are Accessible to beginners new to programming or to RStudio
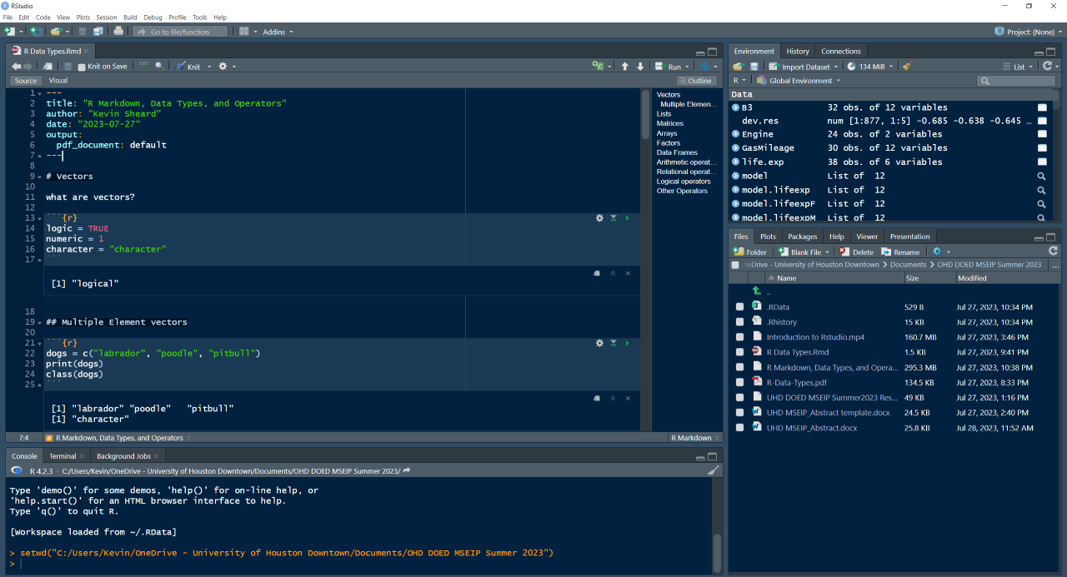
Introduction to Rstudio |
|
|
▪Navigating the environment of RStudio, such as panels and menu bars ▪Installing and loading packages ▪Introducing RMarkdown files |
 |
|
|
|
|
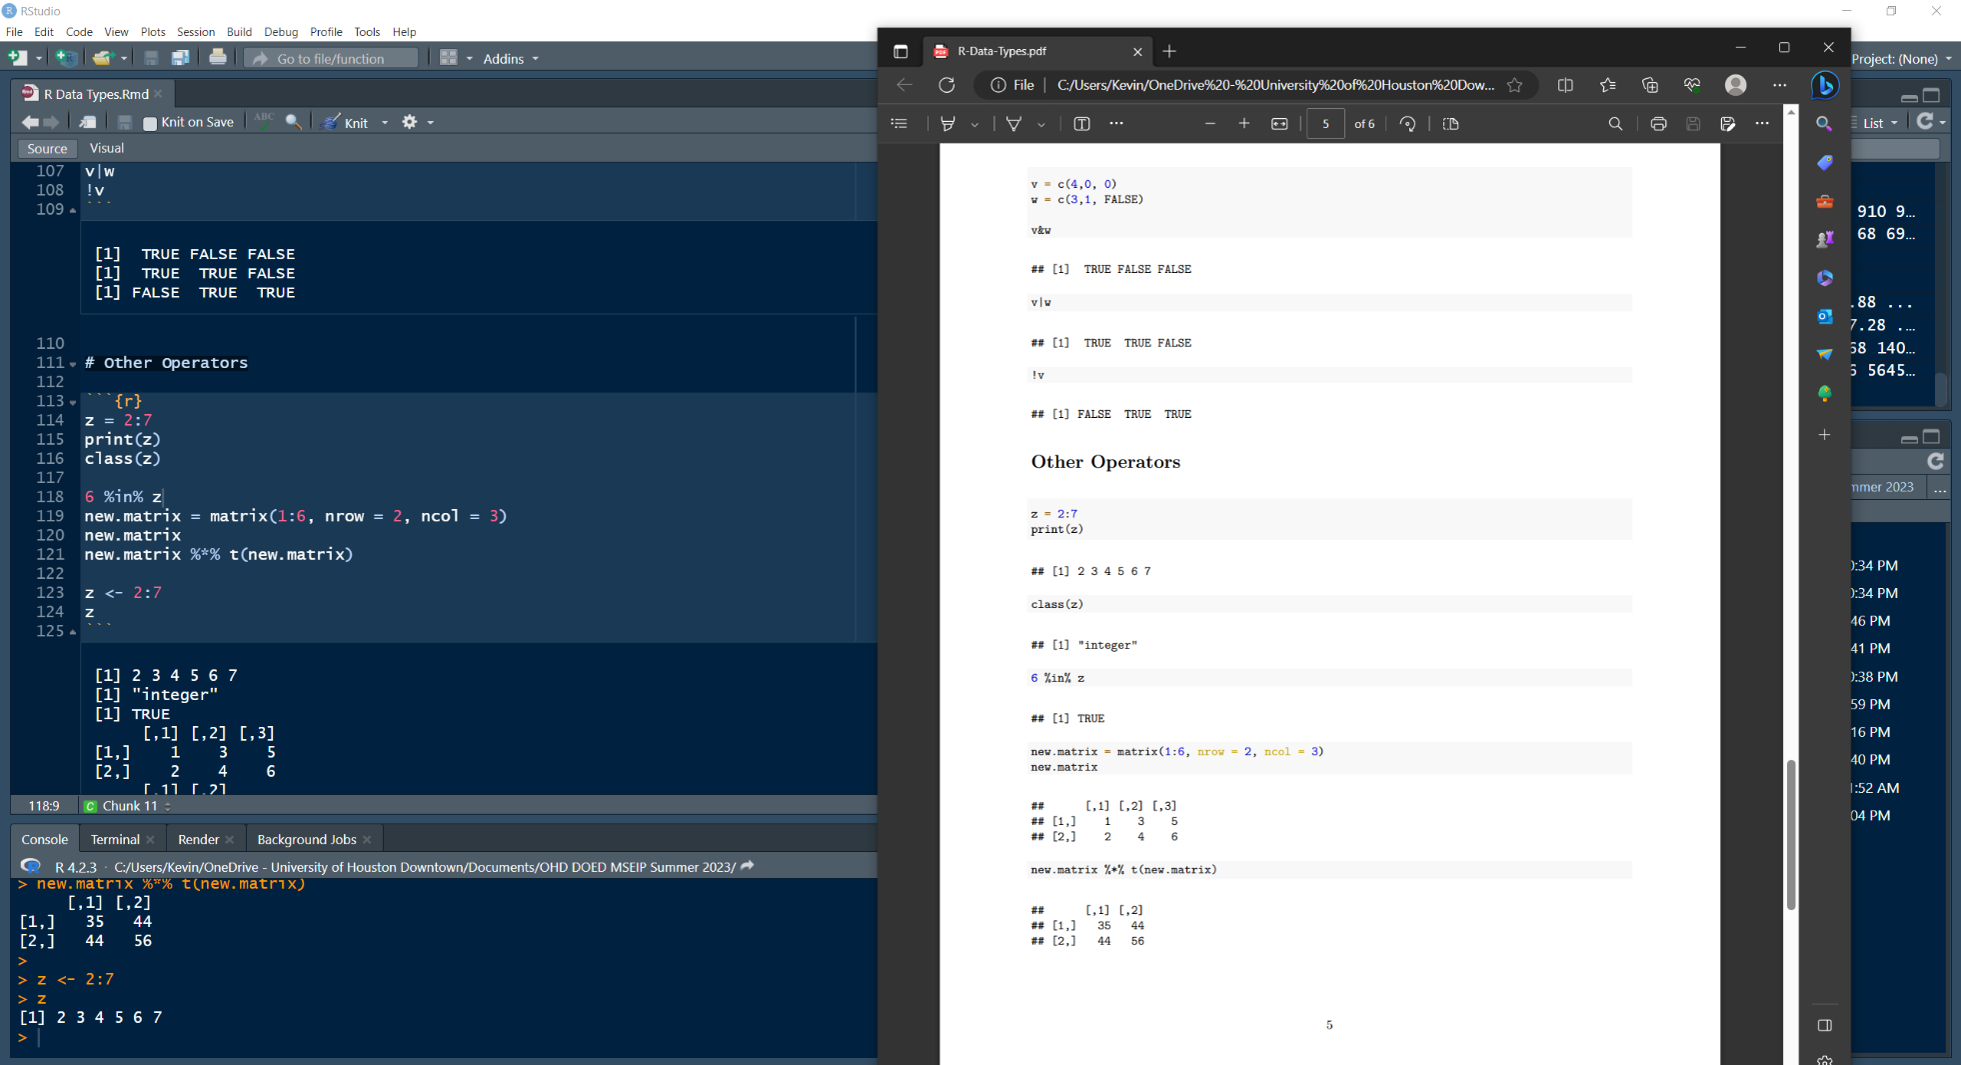
▪Data types ▪Operators ▪RMarkdown |
 |
|
|
|
|
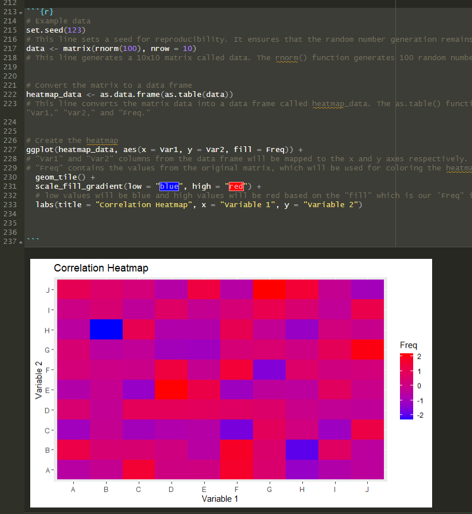
▪Graphically representing data to provide clear and intuitive ways to understand data ▪Bar graph, histogram, line graph, scatter plot, box plot, pie chart, heatmap, area chart |
 |
|
Supporting documents
|
|
Introduction to dplyr |
|
|
▪dplyr is a package used with R that gives an array of powerful and intuitive set of functions for data manipulation |
|
|
Major functions
|
|
|
filter() slice() arrange() select() rename()
|
mutate() relocate() summarise() group_by() Pipes, %>%
|
|
|
|
|
Future Goals
|
|